Paper
Evidence-controlled manuscript pipeline. Results, Discussion, and the final Abstract are intentionally left undrafted — see paper/RESULTS_DRAFT.md, which states plainly: “No prose result claims are drafted until verified artifacts and the claim-evidence matrix support them.”
Section status
| Section | Status |
|---|---|
| Abstract | Planned |
| Introduction | Planned |
| Related Work | Planned |
| Research Gap | Planned |
| Methodology | Running |
| Dataset | Running |
| Chronological Evaluation Protocol | Running |
| Models | Running |
| Resource-Aware Explainability | Planned |
| Fidelity | Planned |
| Stability | Planned |
| TinyML Deployment | Planned |
| Energy Measurement | Planned |
| Results | Planned |
| Discussion | Planned |
| Threats to Validity | Planned |
| Reproducibility | Running |
| Conclusion | Planned |
Claim–evidence matrix
Every candidate claim is linked to its experiment ID, dataset/config hash, git commit, and result artifact — status SUPPORTED or UNSUPPORTED, decided by the artifact, not by narrative convenience.
| ID | Claim | Metric | Status |
|---|---|---|---|
| C001 | The independently acquired dataset passed structural validation | validation | SUPPORTED |
| C002 | Raw features have measured distribution differences relative to batch 1 | normalized_wasserstein | SUPPORTED |
| C003 | All evaluated classical models have lower B10 than B2 accuracy | accuracy | SUPPORTED |
| C004 | Expanding-window retraining improves mean accuracy for all evaluated models | accuracy_change | SUPPORTED |
| C005 | IID diagnostic accuracy exceeds mean fixed-origin future accuracy for all evaluated models | accuracy_gap | SUPPORTED |
| C006 | Global drift has a consistent statistically supported association with performance | Spearman | UNSUPPORTED |
| C007 | Some batch-2 predictive features combine above-median importance with below-median drift | permutation_importance_macro_f1 | SUPPORTED |
| C008 | Global permutation-importance (macro-F1) rankings and single-feature-ablation local explanations were generated for all four evidence-selected FIXED_ORIGIN models across all nine evaluation batches, with no unjustified explanation method forced onto an incapable model | permutation_importance_macro_f1 | SUPPORTED |
| C-XAI-FID-01 | Top-ranked features produced greater predictive degradation than matched random features for every tested model/method/batch/K combination. | selected_minus_random with CI | UNSUPPORTED |
| C-XAI-FID-02 | Explanation fidelity was constant across chronological drift batches. | batch-conditioned bootstrap CI | UNSUPPORTED |
| C-XAI-FID-03 | Explanation fidelity was equivalent for correct and misclassified predictions. | category-conditioned local fidelity | UNSUPPORTED |
| C-XAI-STAB-01 | Top-K explanation rankings remain more similar across adjacent batches than widely separated anchor comparisons. | adjacent_minus_far_anchor_jaccard_ci_low_gt_0 | UNSUPPORTED |
| C-XAI-STAB-02 | Explanation change increases as measured sensor-distribution shift increases across all eligible models. | explanation_distance_vs_input_change_spearman_ci_low_gt_0 | UNSUPPORTED |
| C-XAI-STAB-03 | Explanation stability differs between correct and misclassified predictions. | correct_minus_misclassified_distance_ci_excludes_0 | UNSUPPORTED |
| C-XAI-STAB-04 | Physical sensor-level attribution change increases systematically with chronological input drift across eligible models. | sensor_distance_vs_input_change_spearman_ci_low_gt_0 | UNSUPPORTED |
| C-XAI-STAB-05 | Stage-10 fidelity and Stage-11 stability are positively associated across matched model/method analyses. | matched_fidelity_stability_spearman_ci_low_gt_0 | UNSUPPORTED |
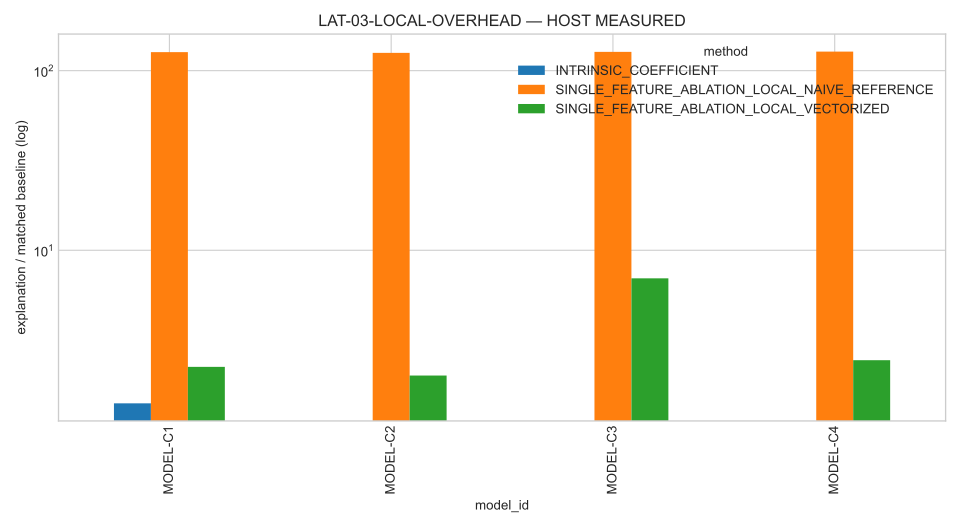
| C-XAI-COST-01 | Local explanation methods differ materially in host computational overhead relative to corresponding baseline inference. | At least one matched local-method overhead ratio differs by >=2x: True. | SUPPORTED |
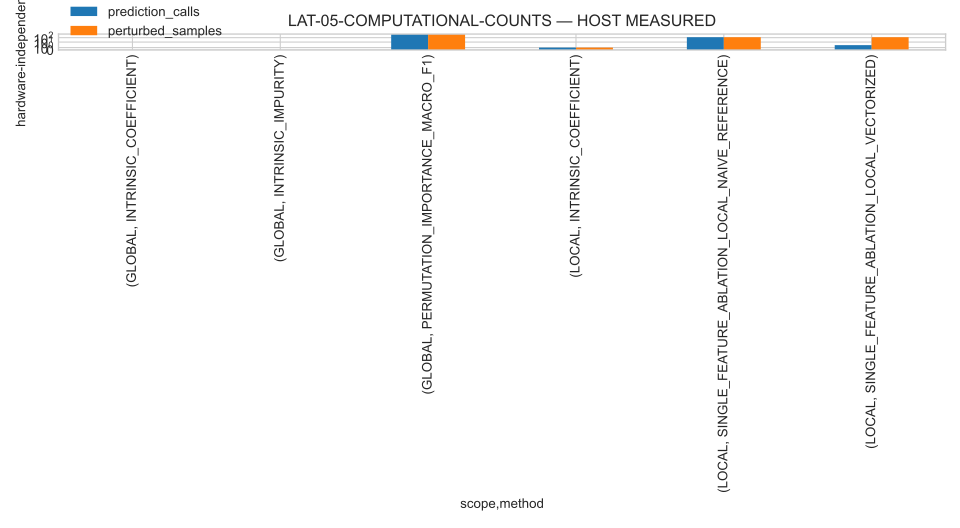
| C-XAI-COST-02 | A substantial fraction of local ablation cost is explained by repeated model evaluations. | Additional-call criterion=True; model-level Spearman rho=1.000, but positive bootstrap CI is not established with N=4 models. | UNRESOLVED |
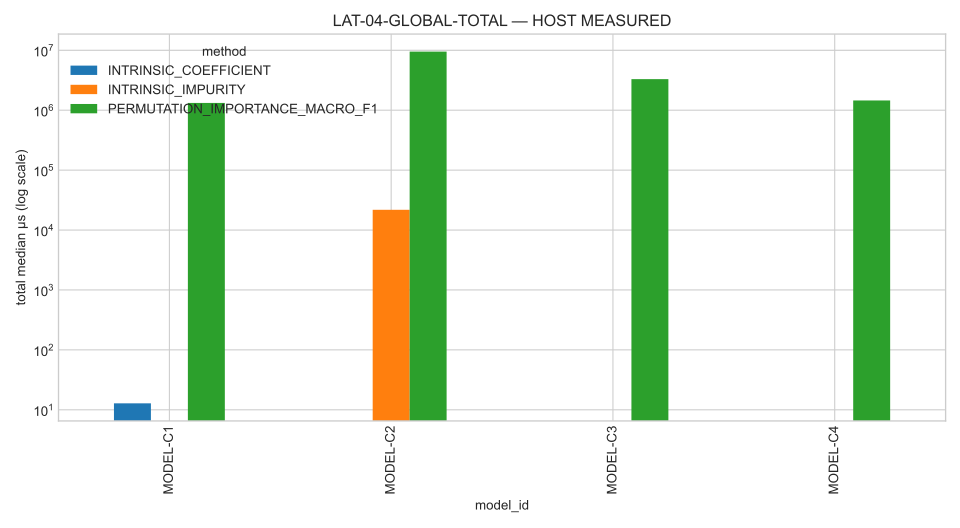
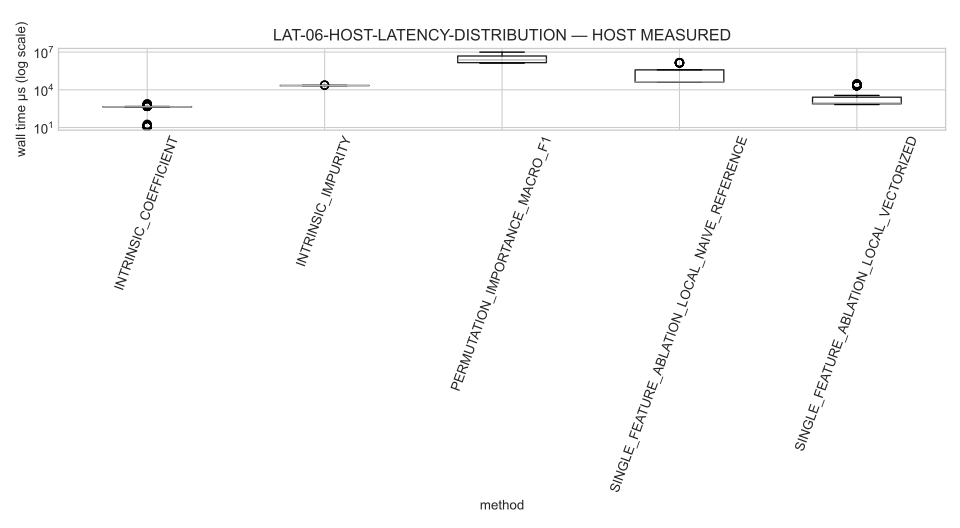
| C-XAI-COST-03 | Intrinsic extraction has lower recurring host cost than perturbation-based generation within comparable global scope. | Intrinsic extraction is below permutation p05 for both applicable models: True. | SUPPORTED |
| C-XAI-COST-04 | No single method dominates simultaneously on fidelity, stability, and host computational cost. | Stage-10/11 method coverage is incomplete for a fully matched dominance test; no universal composite score was constructed. | UNRESOLVED |
| C-EMBED-FP32-01 | MODEL-C1 standalone FP32 implementation reproduces the frozen reference within all Stage-13 criteria. | all_preregistered_mandatory_criteria | UNSUPPORTED |
| C-EMBED-FP32-02 | MODEL-C4 standalone FP32 implementation reproduces the frozen reference within all Stage-13 criteria. | all_preregistered_mandatory_criteria | UNSUPPORTED |
| C-EMBED-FP32-XAI-01 | MODEL-C1 local coefficient explanation is reproduced within separately frozen explanation criteria. | all_preregistered_mandatory_criteria | UNSUPPORTED |
| C-EMBED-C1-REPAIR-01 | At least one prospectively defined all-FP32 explicit StandardScaler representation satisfies all frozen C1 criteria. | all_frozen_mandatory_criteria | UNSUPPORTED |
| C-EMBED-C1-REPAIR-XAI-01 | The selected repaired C1 representation preserves local coefficient explanations within frozen criteria. | all_frozen_mandatory_criteria | UNSUPPORTED |
Full matrix: paper/claim_evidence_matrix.csv
Figures (38)
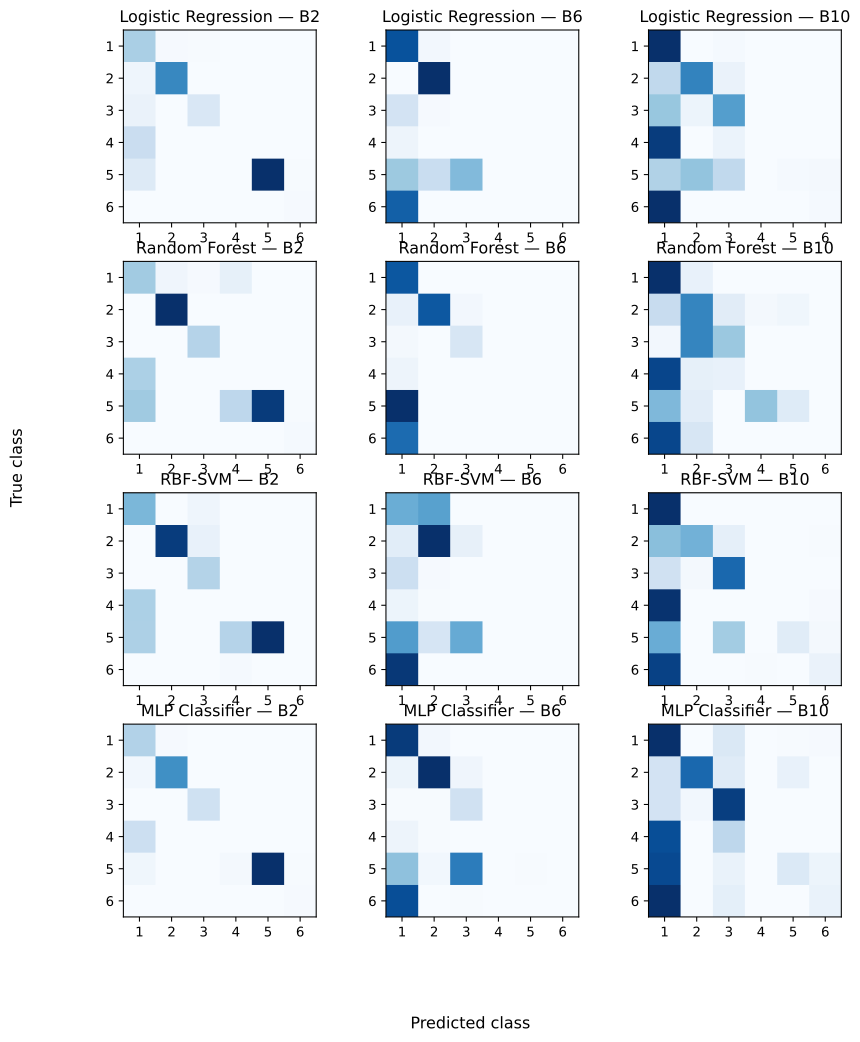
confusion matrix evolution · source
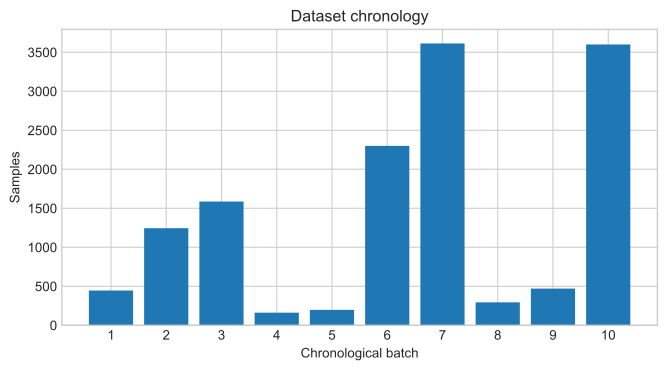
dataset timeline · source
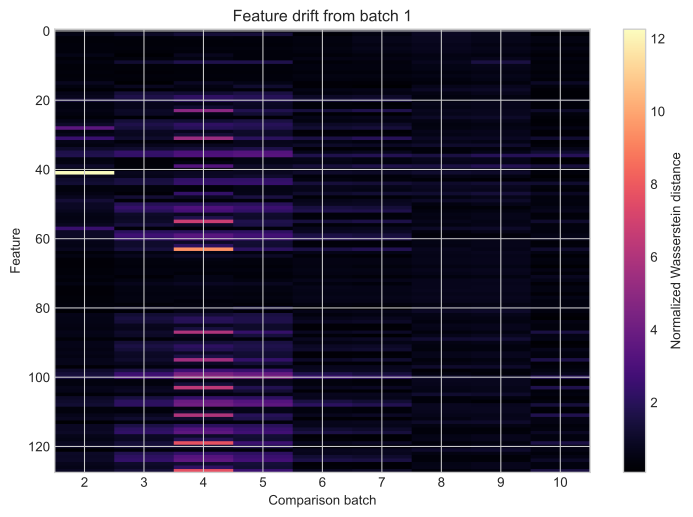
feature batch drift heatmap · source
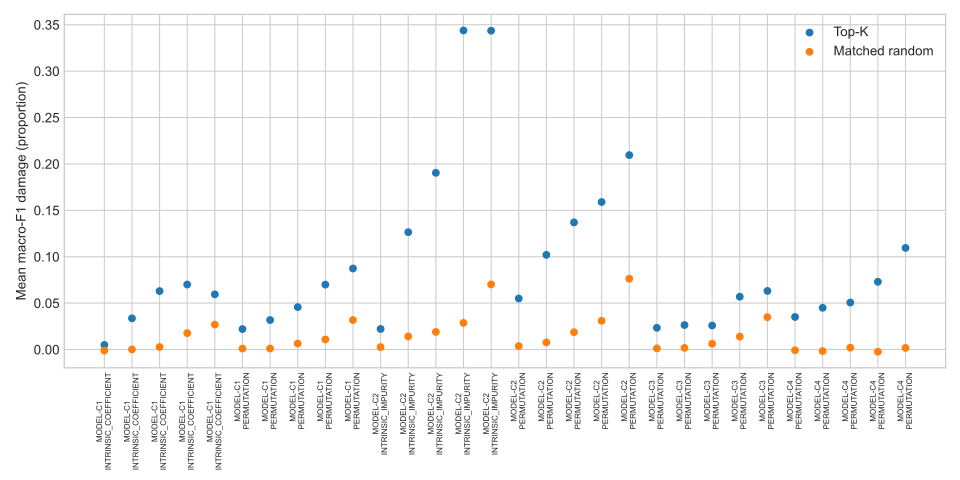
fid 01 deletion vs random · source
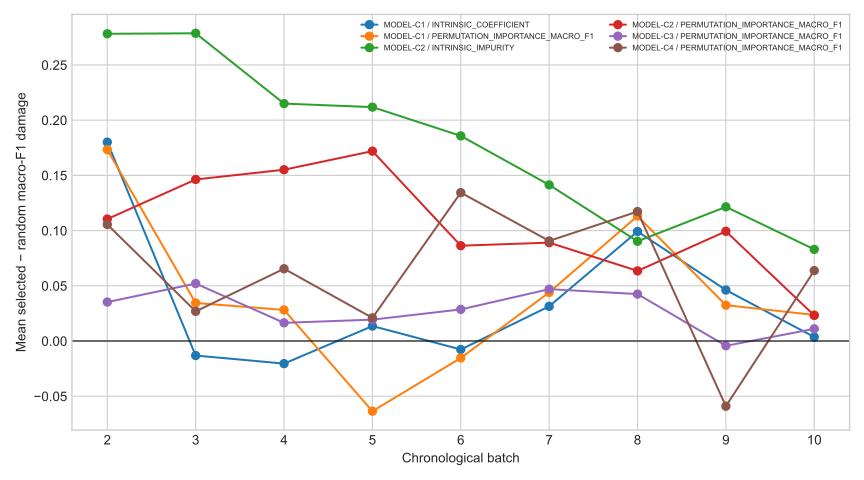
fid 02 chronological fidelity · source
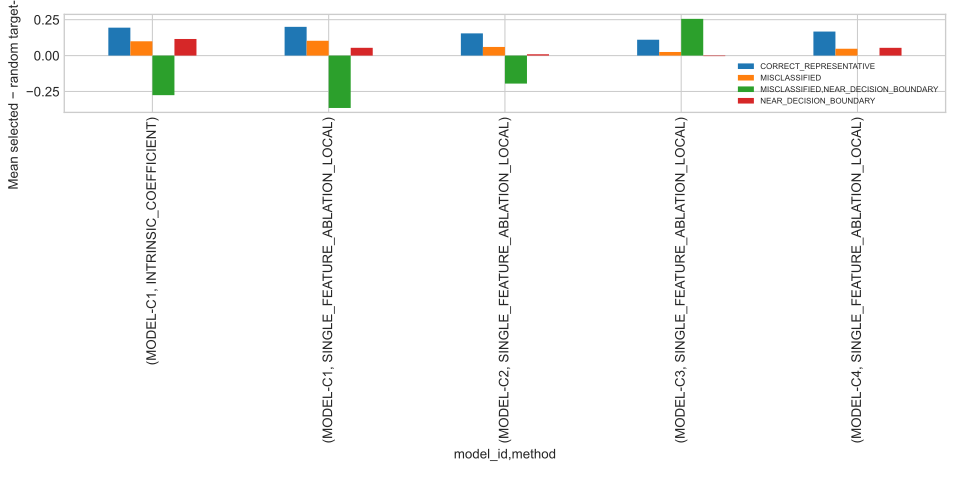
fid 03 error conditioned · source
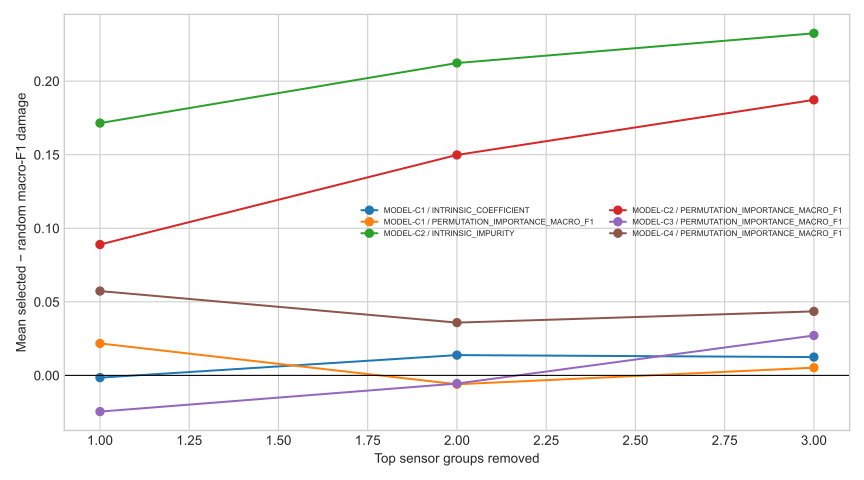
fid 04 sensor groups · source
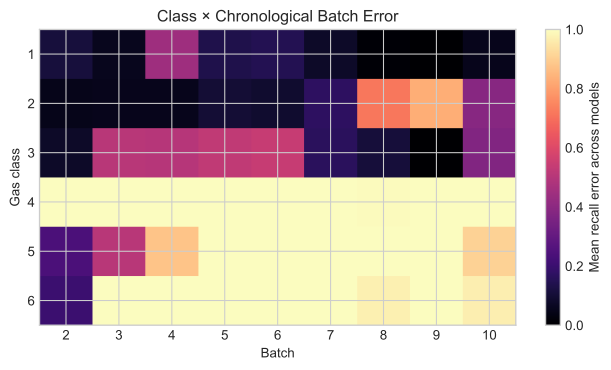
figure 10 class error heatmap · source
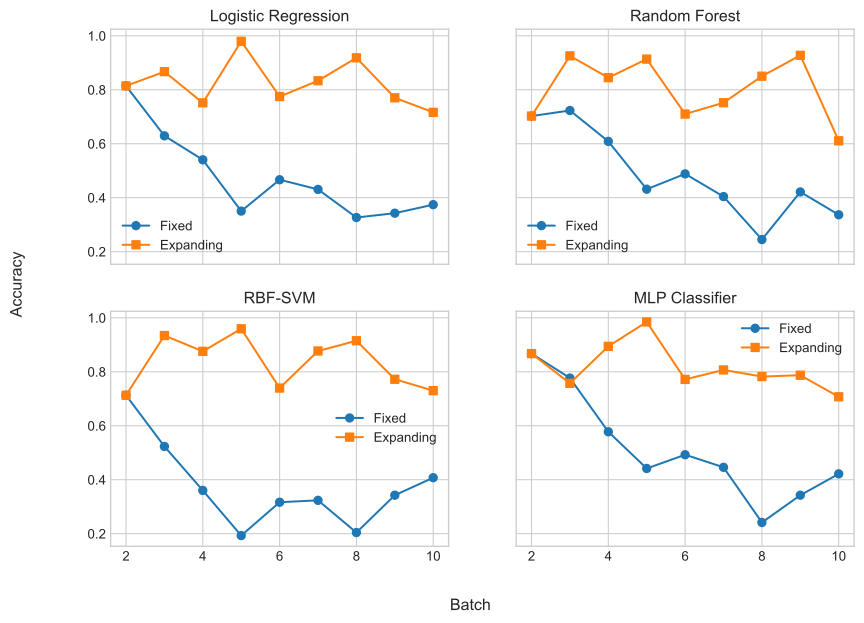
figure 11 fixed vs expanding · source
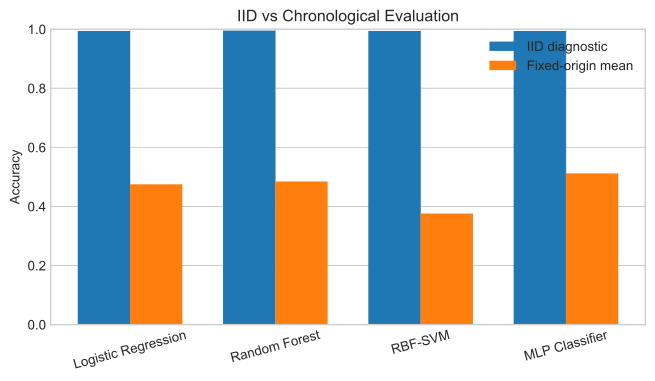
figure 12 iid vs chronological · source
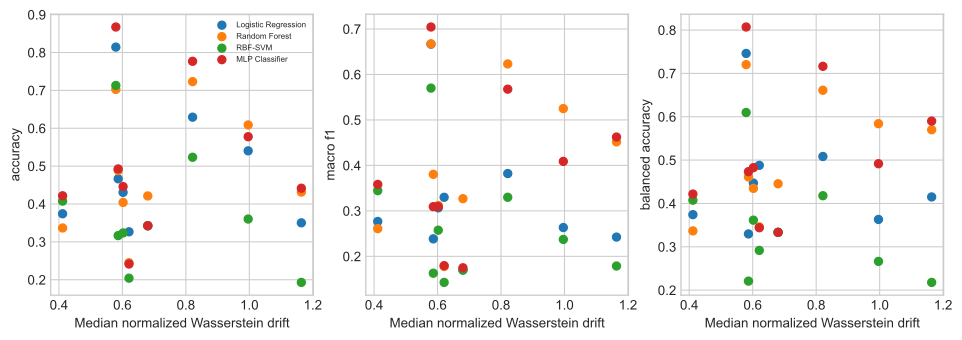
figure 13 drift vs performance · source
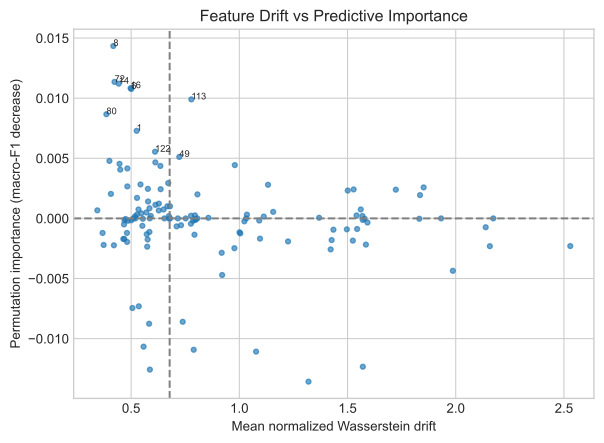
figure 14 feature drift vs importance · source
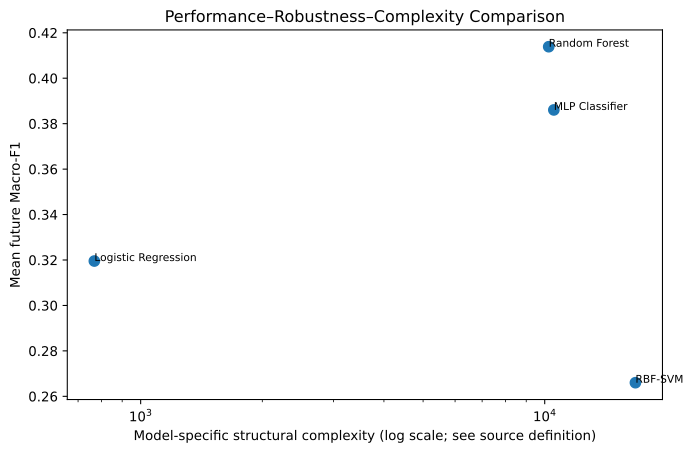
figure 15 complexity comparison
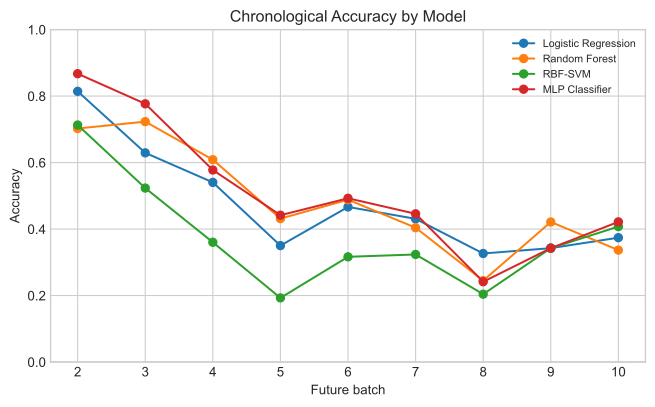
figure 6 accuracy · source
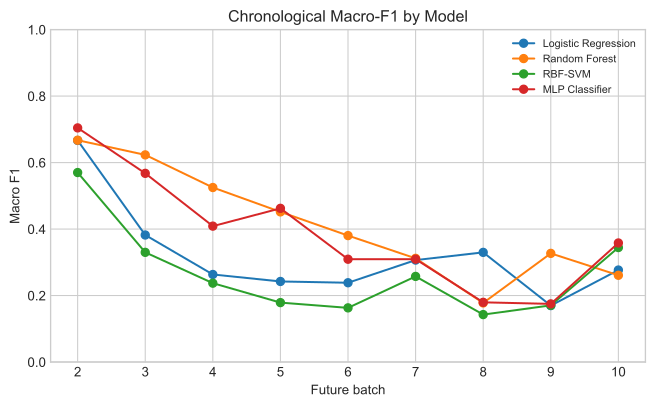
figure 7 macro f1 · source
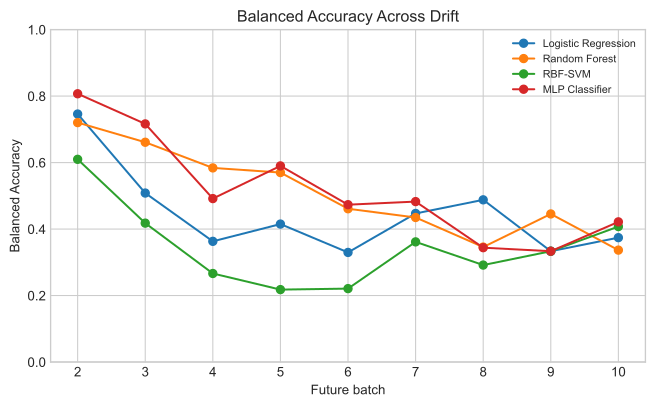
figure 8 balanced accuracy · source
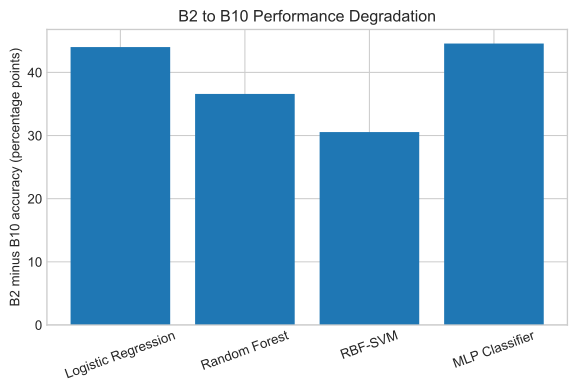
figure 9 degradation · source
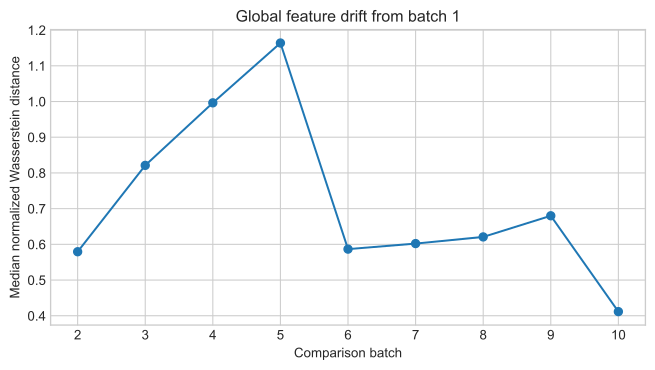
global drift trajectory · source
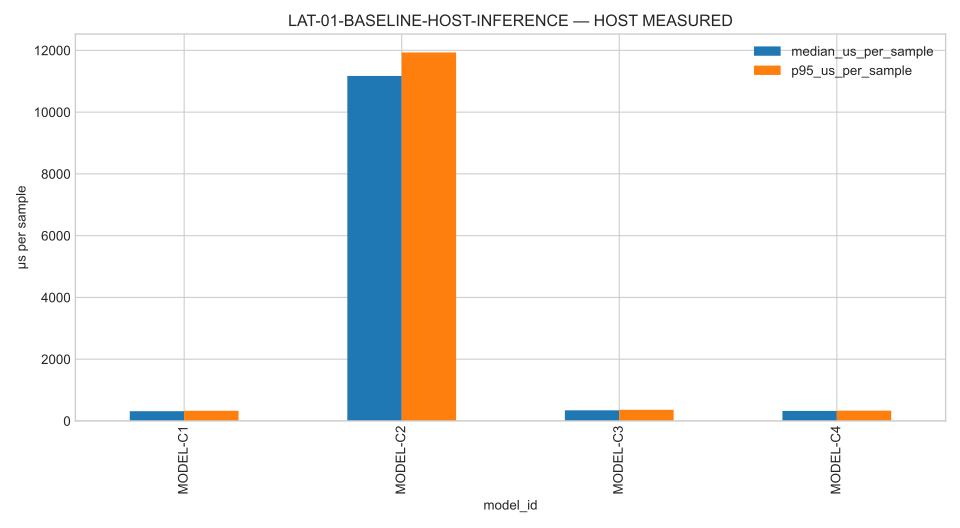
lat 01 baseline host inference · source
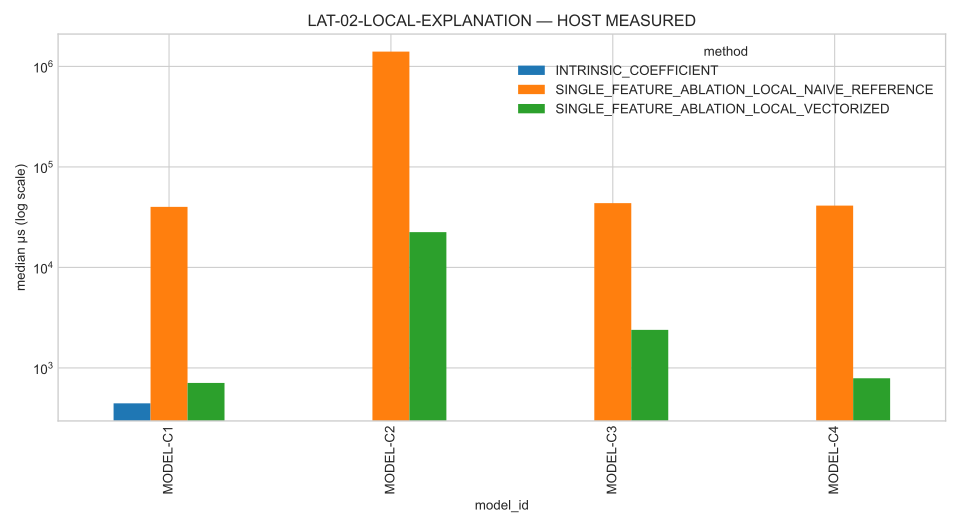
lat 02 local explanation · source
lat 03 local overhead · source
lat 04 global total · source
lat 05 computational counts · source
lat 06 host latency distribution · source
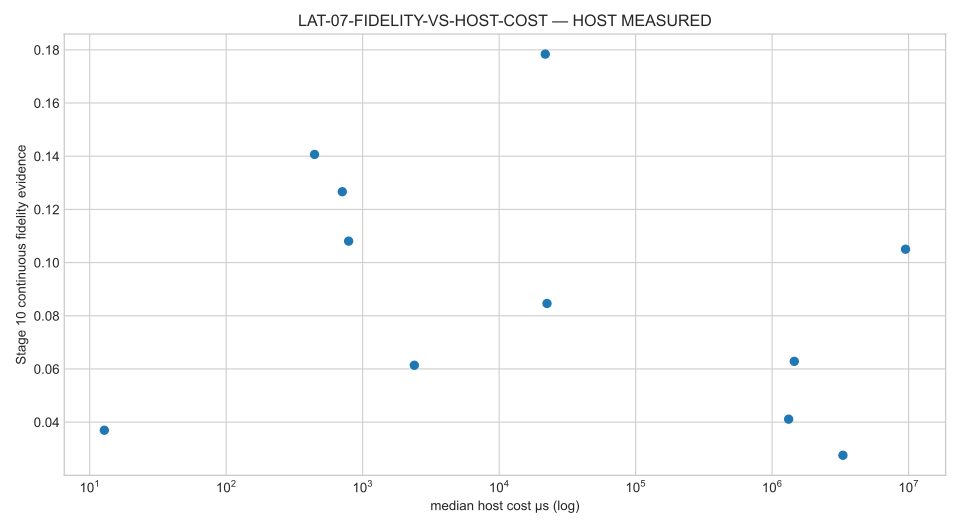
lat 07 fidelity vs host cost · source
lat 08 stability vs host cost · source
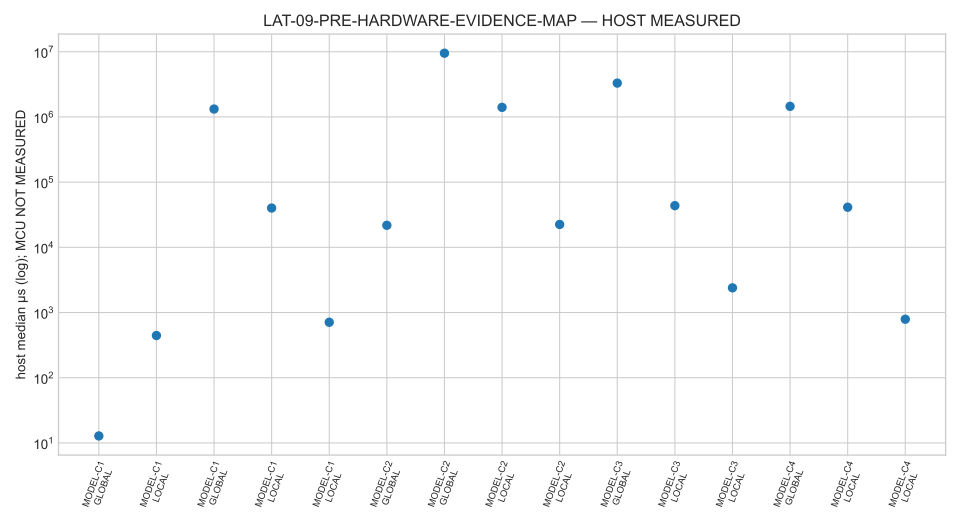
lat 09 pre hardware evidence map · source
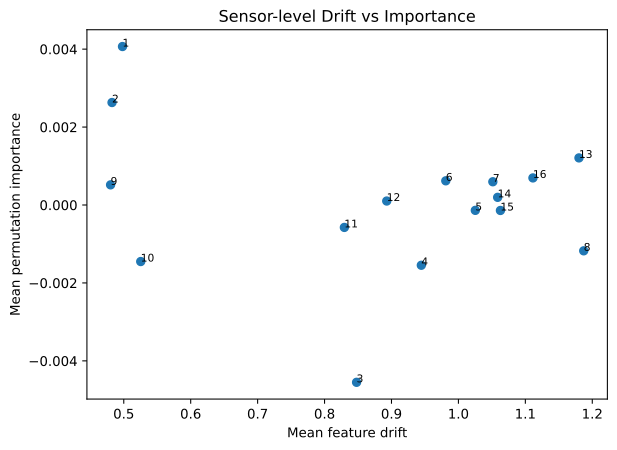
sensor drift vs importance · source
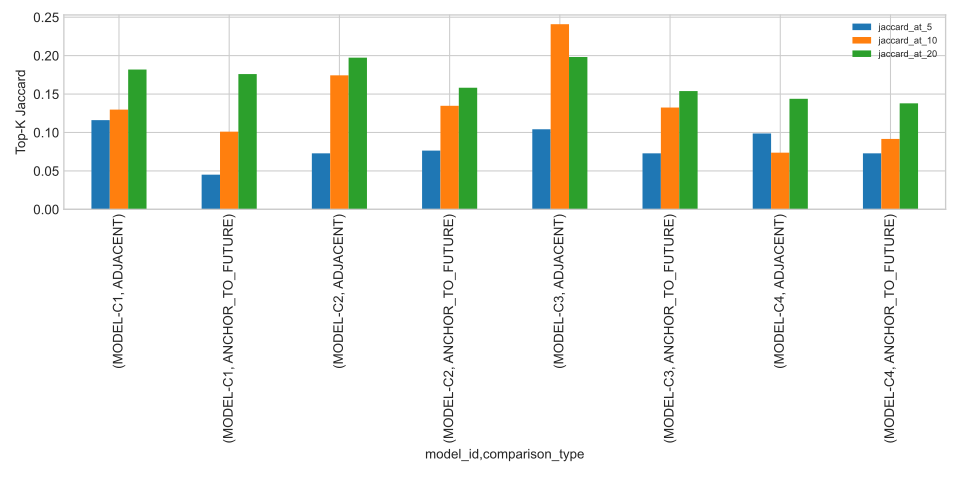
stab 01 topk overlap · source
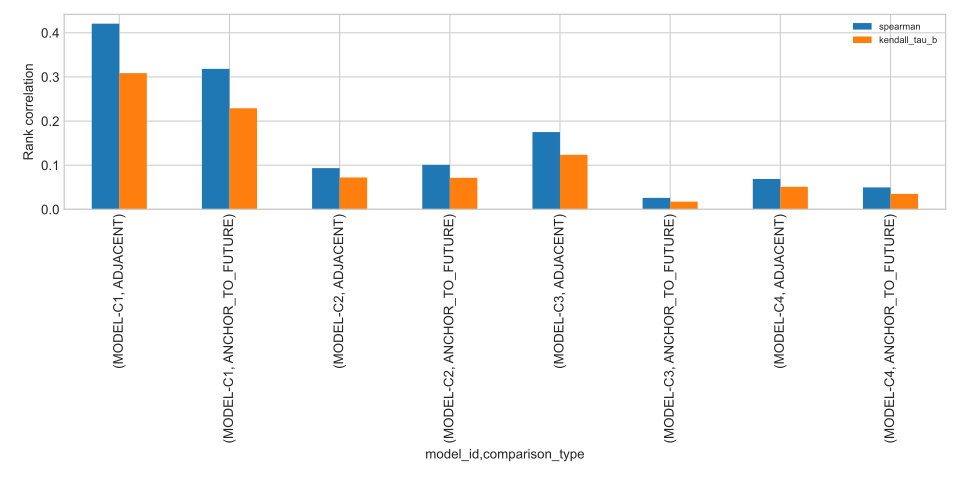
stab 02 rank stability · source
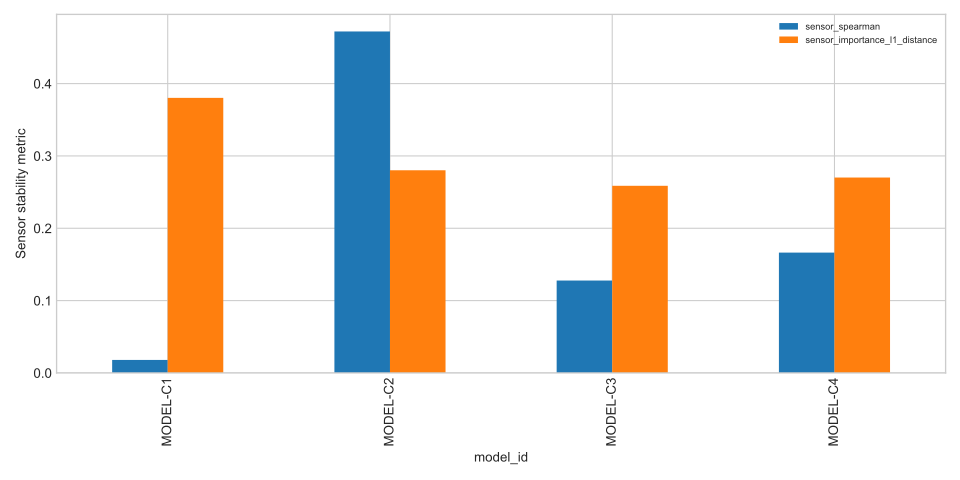
stab 03 sensor stability · source
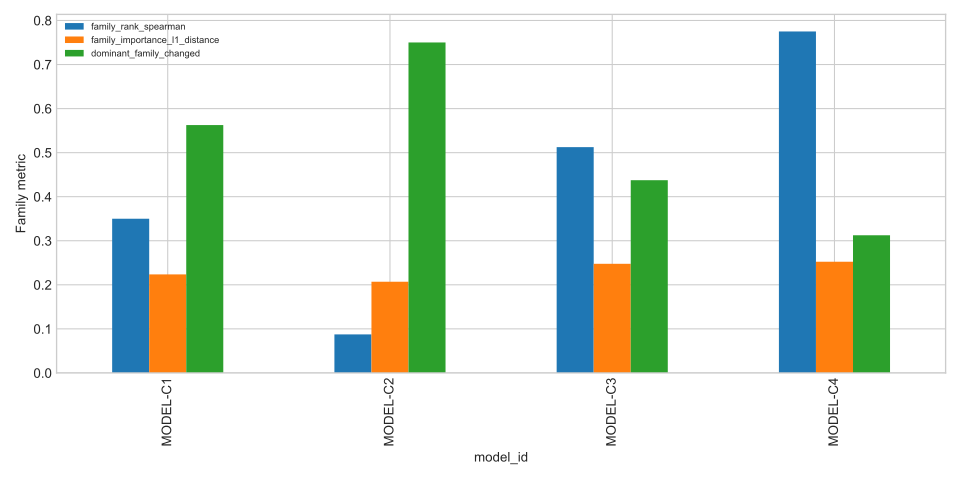
stab 04 family evolution · source
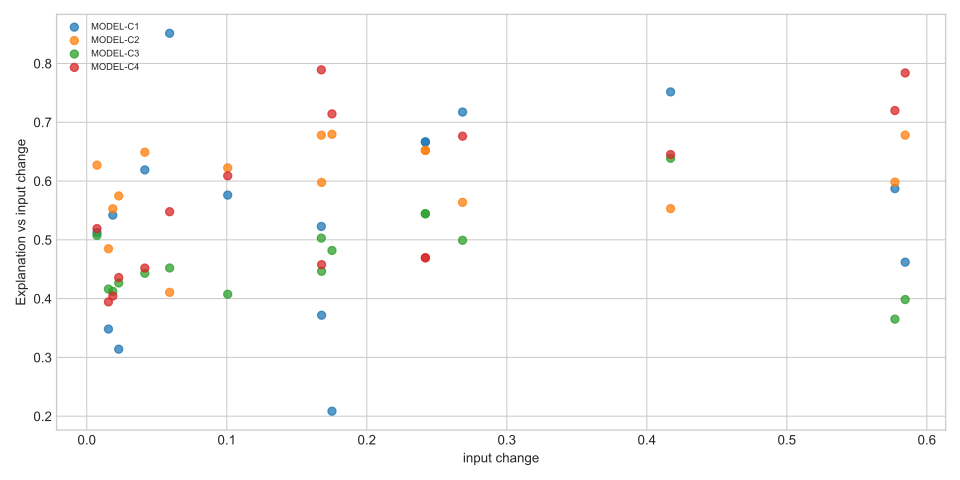
stab 05 explanation vs input · source
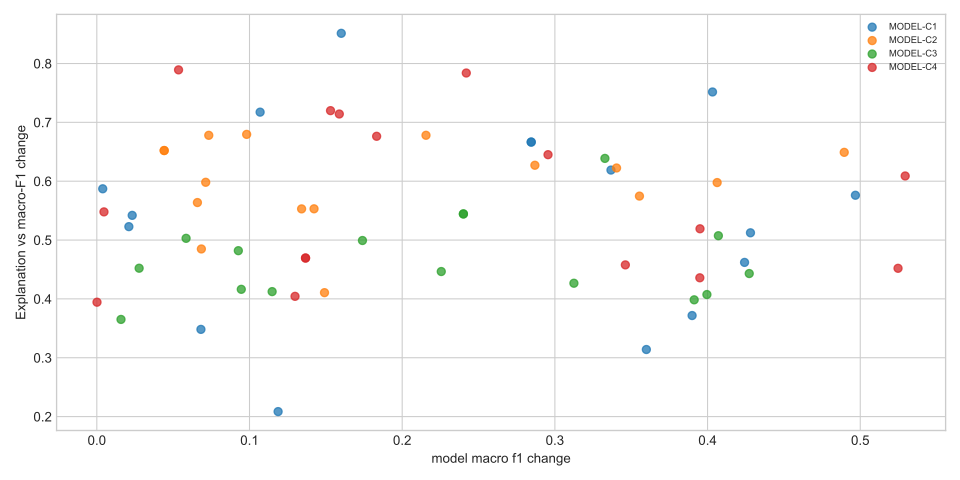
stab 06 explanation vs performance · source
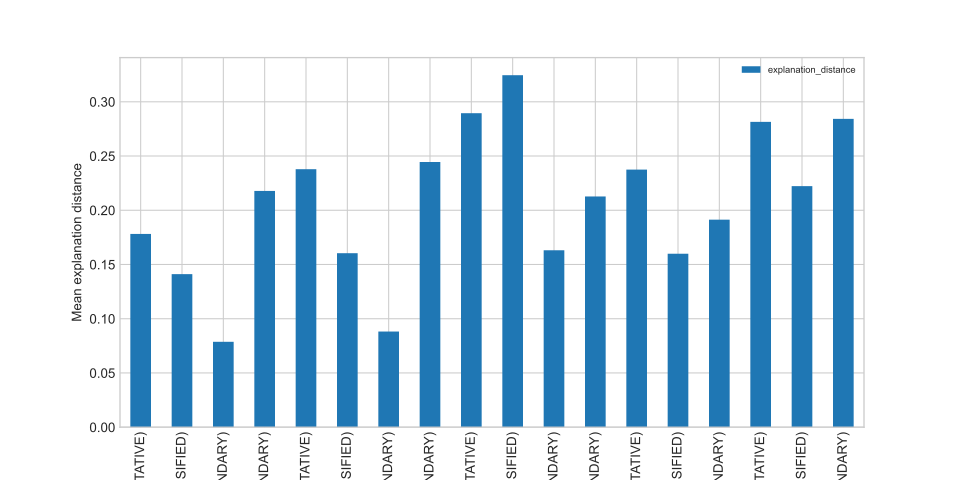
stab 07 error conditioned · source
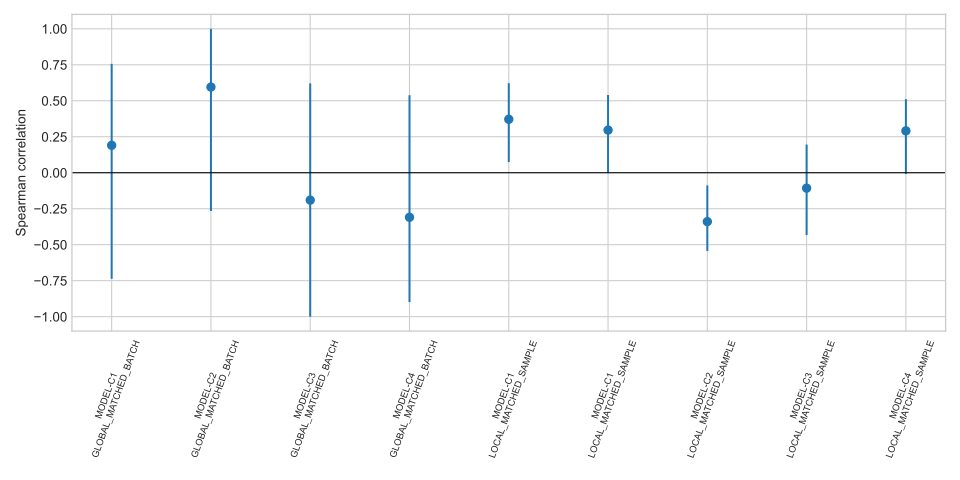
stab 08 fidelity vs stability · source
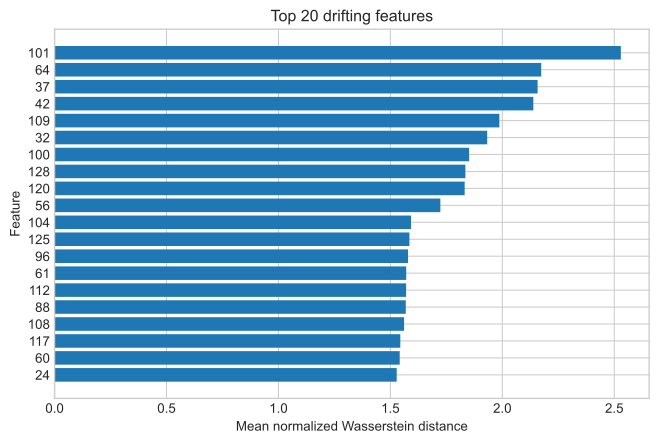
top20 drifting features · source
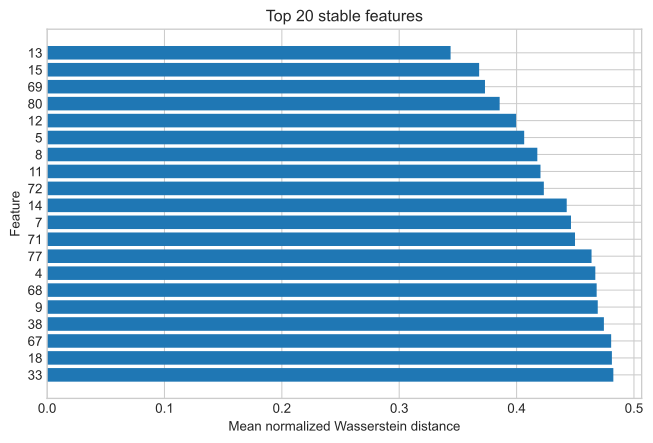
top20 stable features · source